Analytics
Welcome to the Analytics page! This powerful dashboard provides a comprehensive view of your Vinted sales performance, helping you track revenue, expenses, profit, and other important metrics. Make data-driven decisions to optimize your reselling strategy.
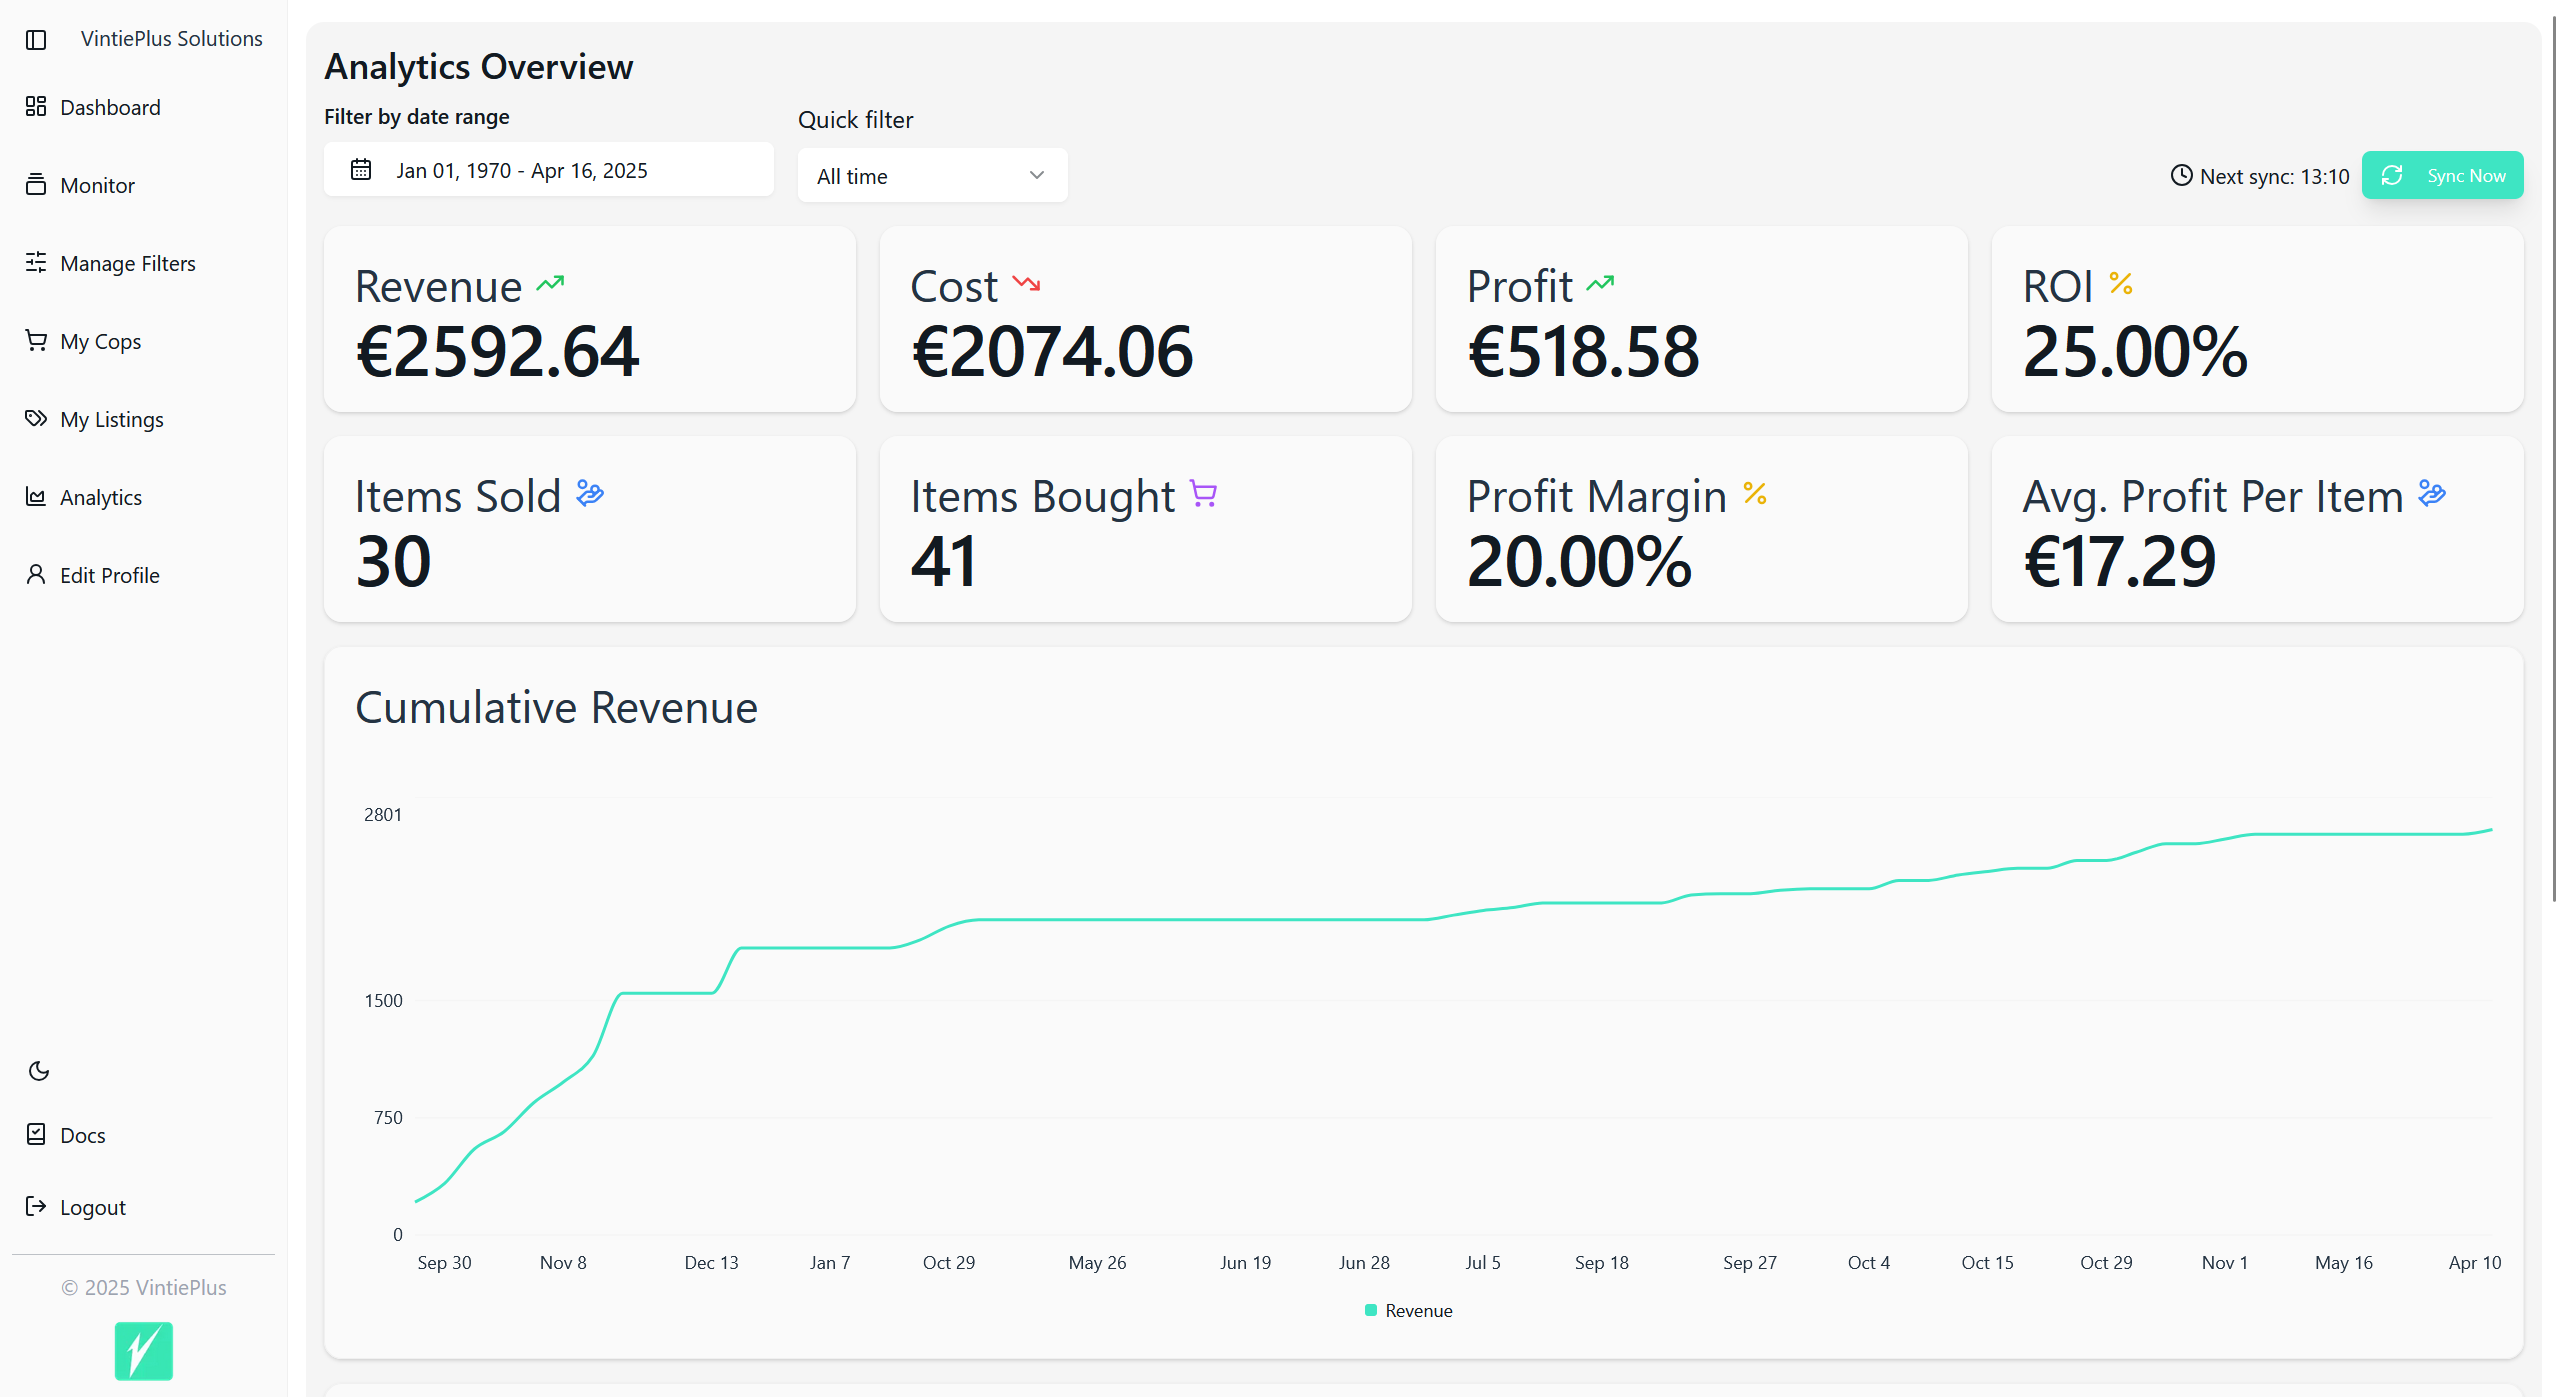
📈 Key Performance Metrics
At the top of the Analytics page, you'll find a series of key performance cards that give you a quick snapshot of your business:
-
Revenue
- Total income generated from your Vinted sales.
-
Cost
- Total amount spent on purchasing items.
-
Profit
- Your net earnings (Revenue minus Cost).
-
ROI (Return on Investment)
- Percentage return on your initial investment.
-
Items Sold
- Total number of items you've successfully sold.
-
Items Bought
- Total number of items you've purchased.
-
Profit Margin
- Your profit expressed as a percentage of revenue.
-
Average Profit per Item
- Mean profit generated from each item sold.
📊 Performance Charts
The Analytics page features interactive charts that visualize your performance over time:
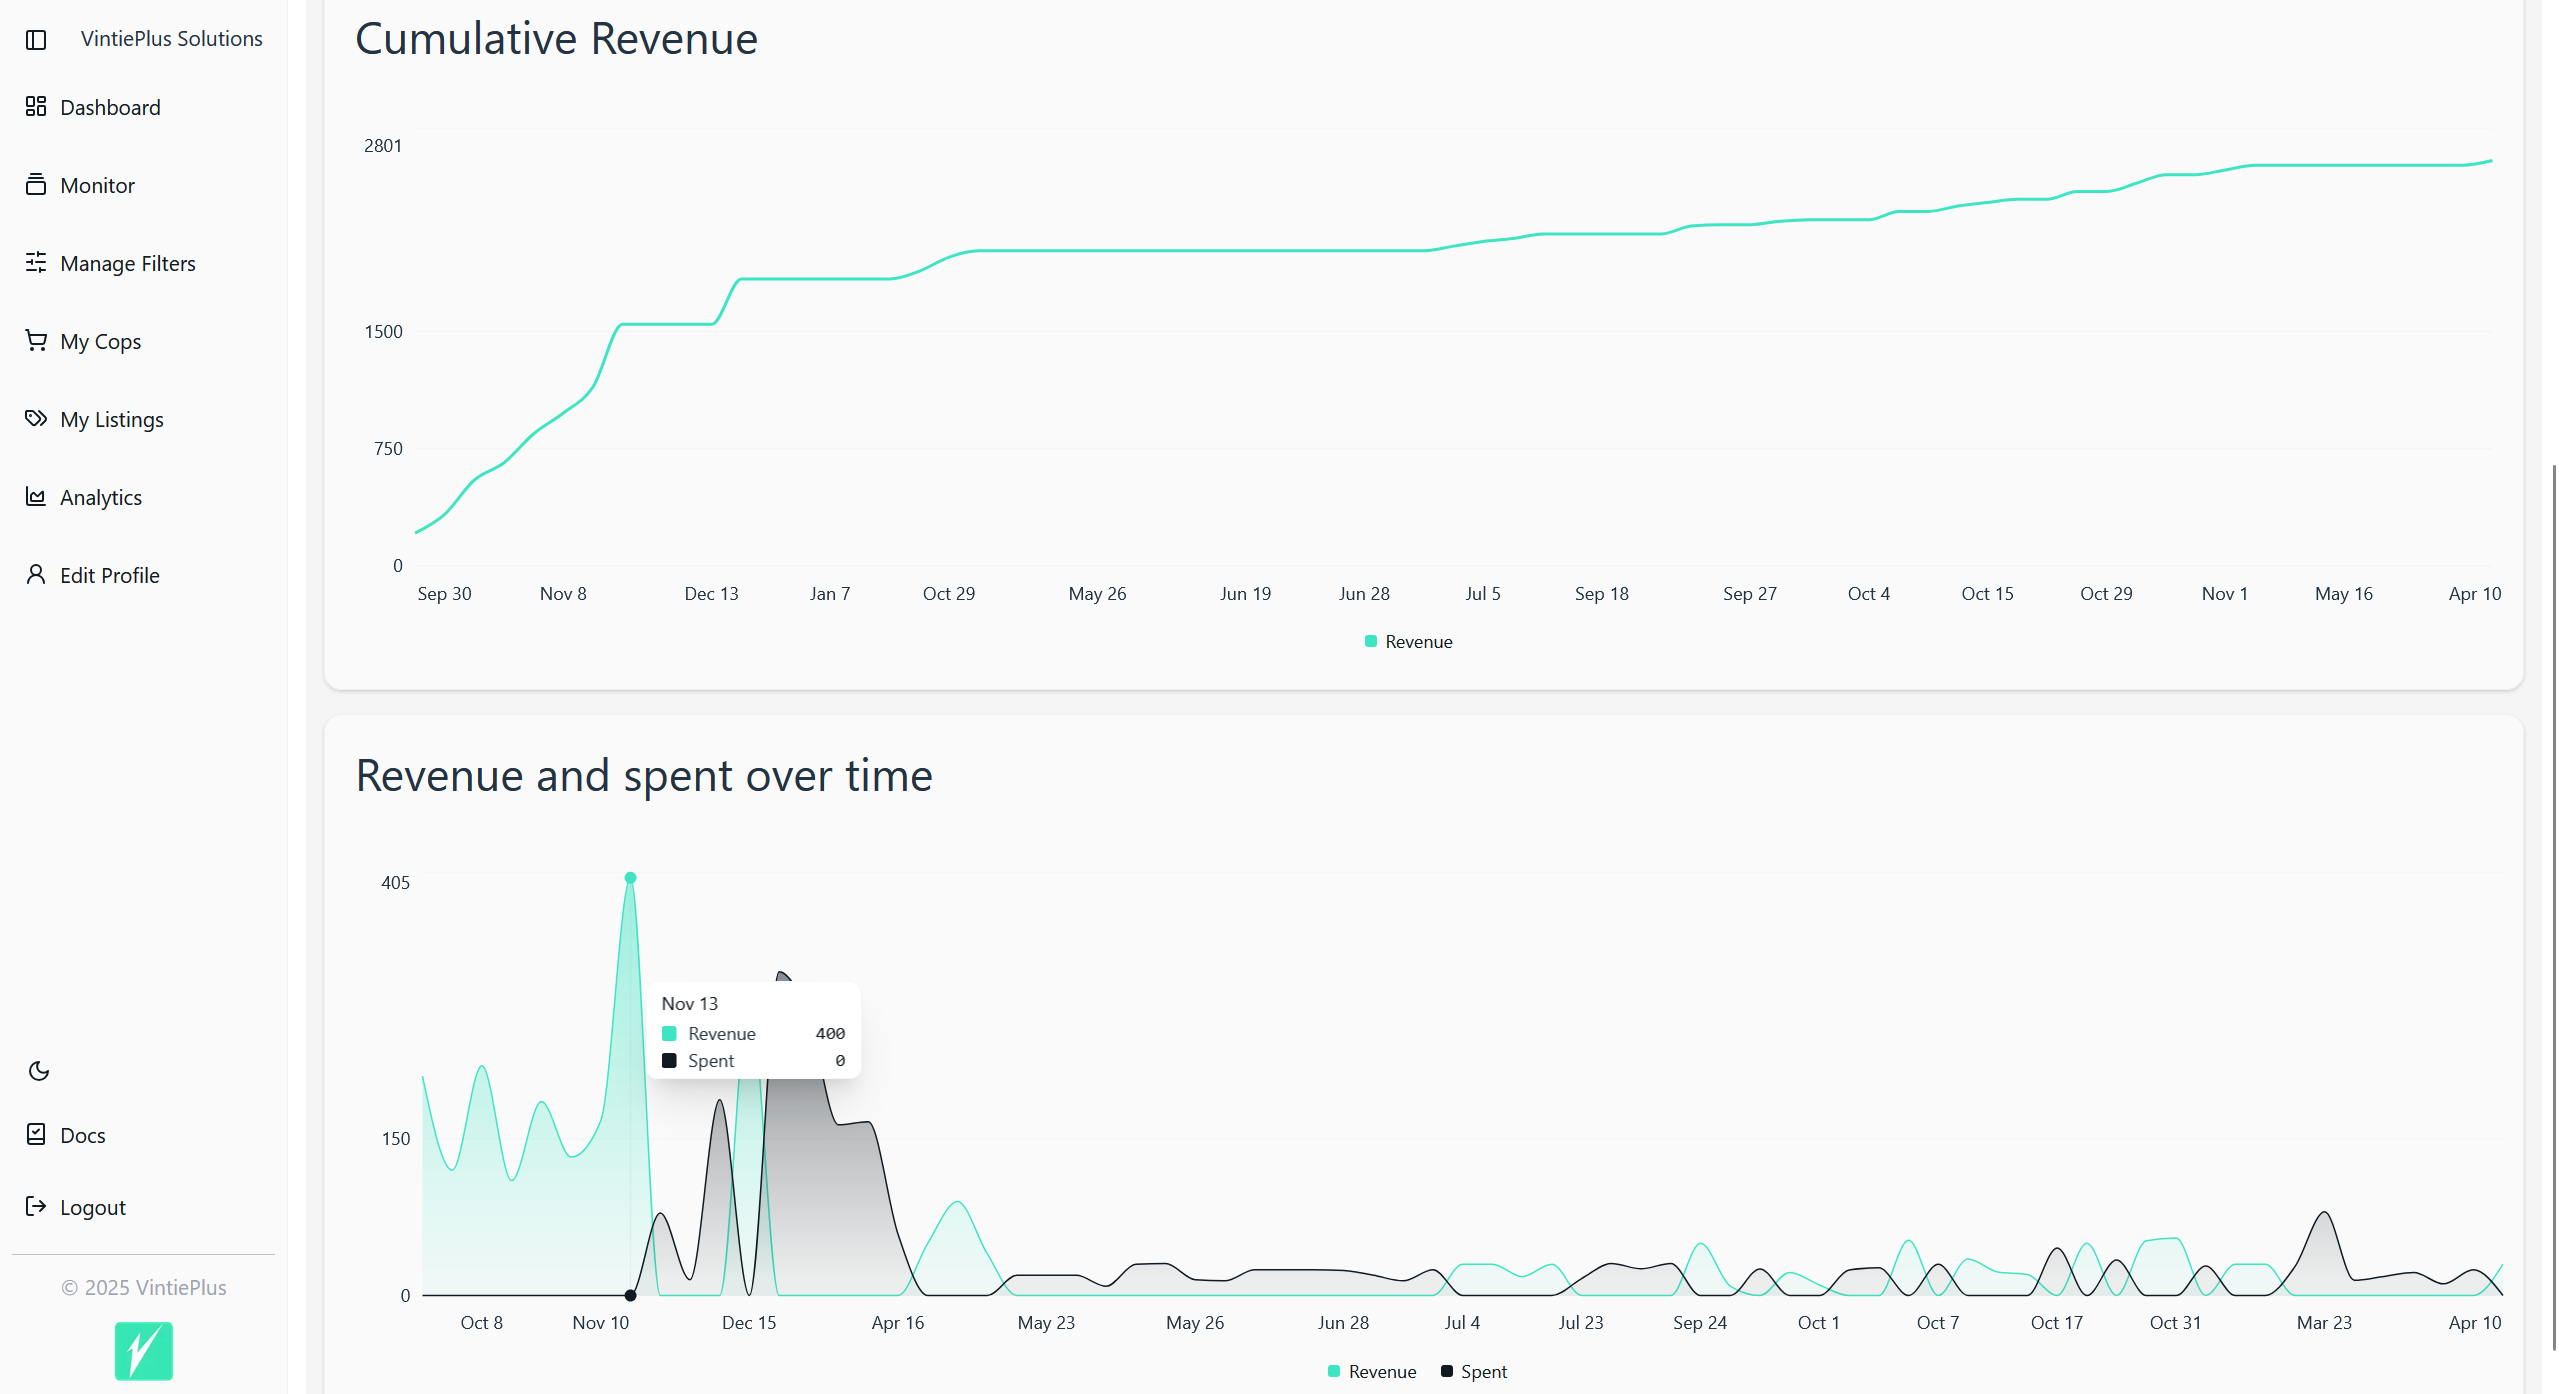
1. Cumulative Revenue Chart
- Shows how your total revenue has accumulated over time.
- Hover over data points to see detailed information in tooltips.
2. Revenue and Spent Over Time
- Compare your revenue against your expenses across different periods.
- Identify profitable time periods and sales patterns.
- Interact with the chart by hovering over data points to see specific values.
🔍 Filtering Your Analytics
Customize your analytics view to focus on specific time periods:
-
Date Range Selector
- Set custom start and end dates to analyze performance during specific periods.
- Perfect for monthly, quarterly, or yearly performance reviews.
-
Quick Filters
- Predefined time periods (e.g., Last 7 Days, Last 30 Days, This Month, etc.) for rapid analysis.
- Click on any quick filter to instantly update all metrics and charts.
🔄 Data Synchronization
Your data is automatically synchronized with Vinted to ensure accuracy:
-
Automatic Sync
- Data is automatically refreshed every 15 minutes to keep your analytics up-to-date.
-
Manual Sync
- Click the Sync button to immediately update your analytics with the latest data from Vinted.
- Useful after making a large number of sales or purchases that you want to see reflected right away.
💡 Tips for Using Analytics
- Regular Review: Check your analytics weekly to stay informed about your business performance.
- Identify Trends: Look for patterns in which items or brands generate the highest profit margins.
- Set Goals: Use historical data to set realistic sales and profit targets.
- Seasonal Analysis: Compare performance across different seasons to optimize your buying strategy.
- ROI Focus: Pay special attention to your ROI metric to ensure you're making smart purchasing decisions.
Track and improve your reselling performance here.